
VBT: Velocity Based Training
- Oct 20, 2019
- 6 min read
Updated: Dec 9, 2023

There are several acute training variables that can be manipulated within resistance training programming in order to drive a specific adaptation (e.g. exercise type and order, intensity or load, sets and repetitions performed and rest periods in between sets). Manipulation of these variables determines the magnitude and type of physiological response and ultimately the adaptation.
Intensity of the exercise is generally acknowledged as being the most important stimulus in regard to strength adaptations and is commonly identified in a number of ways. One method to prescribe intensity is using the repetition max continuum (RM). This requires the athlete to use trial and error to establish the number of repetitions that can be performed to failure with a given sub-maximal load. For example 10RM would be a load that allows the athlete to perform 10 repetitions only.
It is believed that certain performance characteristics are best trained using specific RM load ranges (Campos et al, 2002). However, there is evidence to show that training to failure does not necessarily improve the magnitude of strength gains and may actually be counterproductive due to the excessive fatigue and mechanical/metabolic strain that results (Drinkwater et al, 2007).
Another method of prescribing intensity is by using relative load. This is calculated as a percentage of the maximum absolute load that an athlete can lift for one repetition only (%1RM). Once the maximum load is established, specific adaptions can be trained using a percentage of the 1RM. For example, it has been suggested that for trained athletes maximum strength gains are elicited at intensities at or above 80%1RM (Peterson et al, 2004). Again, there are also limitations to using this method. For example, working with maximal loads can potentially cause injury if the exercise is not performed with correct technique.
Furthermore, the 1RM of an athlete can change rapidly after only a few training sessions, especially in novice athletes; but more importantly an athletes 1RM can fluctuate by approximately 18% on a daily basis due to normal biological variability of the nervous system caused by training related fatigue or lifestyle factors such as sleep, stress and nutrition (Javonovic). This means that if an athlete is to work at an intensity of 80%1RM for a given day, due to the current readiness of their nervous system at that precise moment in time, the load could actually be as high as 98%1RM.
These limitations suggest that an alternative method to objectively identify intensity is desired. Movement velocity is a variable of great interest for monitoring exercise intensity due to the inextricable relationship which exists between load and velocity allowing the practitioner to estimate one from the other with a high level of accuracy (Gonzalez-Badillo).
The velocity of concentric muscle actions decrease with increasing force output and increasing load (Cronin et al, 2003); in other words the heavier the load, the slower the athlete moves in order to complete the lift. As previously mentioned the absolute load an athlete can lift (or their 1RM) can fluctuate daily whereas velocity has been shown to be relatively stable regardless the state of readiness of the nervous system.
The study from Gonzalez-Badillo and Sanchez-Medina (2010) showed this by observing that the average velocity of a lift for a given %1RM did not change over time even though the athletes increased strength. This means that even though the athletes showed an improvement in strength by increasing their 1RM, their movement velocities at a given %1RM remained the same.
Therefore, if we know the velocity at which an athlete moves at a given %1RM we can estimate the 1RM for each session, thus taking into consideration the daily fluctuations in strength and ensuring that the athlete is always training at the desired intensity. This allows the practitioner to autoregulate the load at which an athlete is working at in response to the acute condition of the nervous system on any given day.
Load-Velocity Profile
One method to achieve this is to establish an athletes load-velocity profile for a key exercise. To create the profile the athlete carries out a traditional 1RM test performing at least five lifts with progressively heavier loads until the 1RM is established (Table 1).
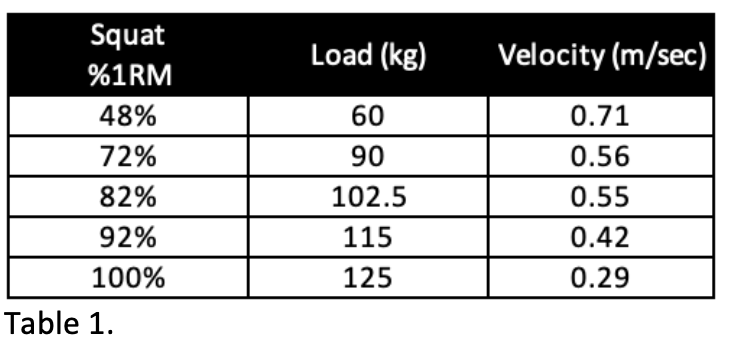
Average velocity at each load is recorded and then plotted into a graph (Figure 1.). A regression line can then be generated that relates load and velocity.

Figure 1. Graph of the load velocity profile for back squat exercise.
The formula provided by the regression line allows the calculation of the average velocity for any given %1RM. Importantly, once the profile has been created, there is now a velocity at which 1RM is attained. Using the regression equation for this athlete (Figure 2.), we now know that 80%1RM in the back squat is performed at an average velocity of 0.53 m/sec.

Therefore, when training to develop maximum strength this athlete should find the load that allows them to move the bar with maximum intent at a velocity 0.53 m/sec. Consequently, the athlete can now use a formula such as this to enter the desired working intensity for a given phase of their program and establish what that velocity should be. The athlete can now be confident that they are training the desired characteristic regardless of the state of the nervous system because the weight on the bar can now be adjusted until the desired velocity is reached.
Monitoring Strength Gains
Consistently measuring the velocity of a fixed load can signify that an increase in strength has occurred. Observing a change in the best velocity achieved with a resistance 80%1RM of approximately 0.04 m/sec usually indicates a change in 1RM strength of approximately 2-2.5%1RM. Using this athlete as an example, that means that if we know the velocity corresponding to 80%1RM is 0.53 m/sec, after a period of strength training, if this load can then be moved at a velocity of approximately 0.57 m/sec, it may be suggested that the 1RM has increased from 125kg to approximately 127-128kg.
Velocity and Fatigue
An additional benefit of creating the load velocity profile is that the velocity attained at 1RM is established (0.29 m/sec). This means that by monitoring the velocity of each repetition, the athlete now knows how close to fatigue they are during any given set. For example, when a set is performed to failure the last repetition will have the same velocity as the athletes 1RM (). Therefore, as this athletes velocity attained at 1RM is 0.29 m/sec then their third repetition of a 3RM, fifth repetition of a 5RM or eighth repetition of an 8RM will all be (or very close to) that 0.29 m/sec (Baker). This can be crucial data if the athlete is looking to minimise the residual fatigue of resistance training if training multiple times a day or week.
Conclusion
Understanding the force velocity profile is important when attempting to apply velocity based training to control intensity of resistance training. An important caveat here is that each individual exercise will display its own unique velocity profile.
For example, normative data shows us the velocity attained at 1RM in the squat is approximately 0.3 m/sec however, in the bench press exercise it is closer to 0.15 m/sec. This is likely due to the difference in bar displacement between the two exercises. Therefore, if using velocity based training to control intensity it would be pertinent to create a load velocity profile for each key exercise within the program.
Monitoring velocity levels on regular basis provides objective data that could then be used to provide greater information into daily strength levels, fatigue levels and readiness of the athlete. It is an accurate way to control intensity of resistance training and allows the auto regulation of daily loads to take into account the day to day fluctuation in 1RM.
This article is by no means exhaustive in terms of the benefits of using VBT, however it may provide adequate information to enable an athlete or practitioner to begin to implement this method into the programming of their resistance training.
References
Campos GE, Luecke TJ, Wendeln HK, Toma K, Hagerman FC, Murray TF, Ragg KE, Ratamess NA,
Kraemer WJ, Staron RS. Muscular adaptations in response to three different resistance-training regimens: specificity of repetition maximum training zones. Eur J Appl Physiol 2002; 88: 50–60
Drinkwater EJ, Lawton TW, McKenna MJ, Lindsell RP, Hunt PH, Pyne DB. Increased number of forced repetitions does not enhance strength development with resistance training. J Strength Cond Res 2007; 21: 841–847
Cronin, J.B., McNair, P.J. and Marshall, R.N. Force-velocity analysis of strength-training techniques and load: implications for training strategy and research. Journal of Strength and Conditioning Research. 17: 148-155. 2003.
Peterson, M. D., Rhea, M. R., & Alvar, B. A. (2004). Maximizing Strength Development in Athletes: A Meta-Analysis to Determine the Dose-Response Relationship. The Journal of Strength and Conditioning Research, 18(2), 377. doi:10.1519/r-12842.1
Comments